UNITED STATES
SECURITIES AND EXCHANGE COMMISSION
Washington, D.C. 20549
FORM
CURRENT REPORT
Pursuant to Section 13 or 15(d) of the Securities Exchange Act of 1934
Date of Report (Date of earliest event reported):
(Exact name of registrant as specified in its charter)
(State or other jurisdiction of incorporation) | (Commission File Number) | (IRS Employer Identification No.) |
100 Technology Center Drive | ||
(Address of principal executive offices) (Zip Code) |
Registrant’s telephone number, including area code: (
(Former name or former address, if changed since last report.)
Check the appropriate box below if the Form 8-K filing is intended to simultaneously satisfy the filing obligation of the registrant under any of the following provisions (see General Instruction A.2. below):
Securities registered pursuant to Section 12(b) of the Act:
Title of each class | Trading Symbol(s) | Name of each exchange on which registered |
Indicate by check mark whether the registrant is an emerging growth company as defined in Rule 405 of the Securities Act of 1933 (§230.405 of this chapter) or Rule 12b-2 of the Securities Exchange Act of 1934 (§240.12b-2 of this chapter).
Emerging growth company
If an emerging growth company, indicate by check mark if the registrant has elected not to use the extended transition period for complying with any new or revised financial accounting standards provided pursuant to Section 13(a) of the Exchange Act. ☐
Item 2.02 Results of Operations and Financial Condition.
On May 8, 2025, Collegium Pharmaceutical, Inc. (the “Company”) issued a press release announcing its financial results for the quarterly period ended March 31, 2025. The full text of the press release issued in connection with the announcement is attached hereto as Exhibit 99.1 and is being furnished, not filed, under Item 2.02 of this Current Report on Form 8-K.
Item 7.01 Regulation FD Disclosure.
On May 8, 2025, Collegium Pharmaceutical, Inc. released an earnings presentation. The presentation is attached hereto as Exhibit 99.2 and is being furnished, not filed, under Item 7.01 of this Current Report on Form 8-K.
Item 9.01 Financial Statements and Exhibits.
(d) Exhibits
Exhibit |
| |
No. | Description | |
99.1 | ||
99.2 | ||
104 | Cover Page Interactive Data File (embedded within the Inline XBRL document) |
SIGNATURES
Pursuant to the requirements of the Securities Exchange Act of 1934, the registrant has duly caused this report to be signed on its behalf by the undersigned hereunto duly authorized.
Collegium Pharmaceutical, Inc. | ||
By: | /s/ Colleen Tupper | |
Colleen Tupper | ||
Executive Vice President and Chief Financial Officer | ||
Dated: May 8, 2025
Exhibit 99.1

Collegium Reports First Quarter 2025 Financial Results and Highlights Recent Company Progress
– Generated Q1’25 Quarterly Net Revenue of $177.8 Million, Up 23% Year-over-Year –
– Grew Jornay PM® Prescriptions by 24% Year-over-Year and Reported Quarterly Net Revenue of $28.5 Million; Jornay PM Prescribers Reached an All-Time-High –
– Completed Jornay PM Field Force Expansion –
– Generated Net Revenue of $149.2 Million from the Pain Portfolio, Up 3% Year-over-Year with All Three Core Products Recording Revenue Growth in the Quarter –
– Ended Q1’25 with Cash, Cash Equivalents and Marketable Securities of $197.8 Million –
– Board of Directors Authorized $25.0 Million Accelerated Share Repurchase Program –
– Reaffirmed Full-Year 2025 Guidance –
– Conference Call Scheduled for Today at 4:30 p.m. ET –
STOUGHTON, Mass., May 8, 2025 -- Collegium Pharmaceutical, Inc. (Nasdaq: COLL) today reported its financial results for the quarter ended March 31, 2025, and provided a business update.
“Collegium is off to a strong start in 2025. We have made significant progress towards our key strategic priorities including growing Jornay PM, maximizing our pain portfolio, and strategically deploying capital to further enhance shareholder value,” said Vikram Karnani, President and Chief Executive Officer. “In addition to generating strong Jornay PM prescription growth, we recently completed an expansion of our ADHD sales force, adding 55 new sales representatives and bringing our expanded sales team to approximately 180 representatives in total. This expanded sales team is now fully trained and deployed to drive additional growth for Jornay PM, our highly differentiated treatment option for patients with ADHD. Our pain portfolio had another solid quarter with robust sales further demonstrating the value of our three differentiated medicines to treat chronic pain. We expect these product revenues to remain durable in the years ahead and to continue to fuel Collegium’s strong cash generation and future growth. Finally, we made some important additions to our leadership team and board of directors, further positioning Collegium for continued long-term success as we build a leading, diversified biopharmaceutical company.”
“In the first quarter of 2025, we grew revenue 23% year-over-year, made targeted investments in our lead growth driver, Jornay PM, and generated strong operating cash flows from our pain business,” said Colleen Tupper, Chief Financial Officer. “We remain on track to achieve our 2025 financial guidance, which reflects robust top- and bottom-line growth and full year Jornay PM net revenue in excess of $135 million. With our continued strong financial results, we were able to increase our cash position to $197.8 million at the end of the quarter while also paying down an additional $16.1 million in debt. In addition, our board authorized a $25 million accelerated share repurchase program, reinforcing our commitment to returning value to shareholders. We are well positioned to execute on our capital deployment priorities, which include expanding our portfolio through disciplined business development, rapidly paying down our debt, and opportunistically repurchasing shares.”
ADHD Business Highlights
| ● | Grew Jornay PM prescriptions 24% year-over-year in the quarter ended March 31, 2025 (the 2025 Quarter). |
| ● | Generated $28.5 million in Jornay PM net revenue in the 2025 Quarter with full-year net revenue expected to be in excess of $135 million. |
| ● | Completed the Jornay PM field force expansion, adding approximately 55 new sales representatives bringing the expanded ADHD sales force to approximately 180 sales representatives in total, to drive additional growth and increase brand awareness and adoption from prescribers. |
| ● | In March, presented two posters highlighting real-world data on Jornay PM at the National Association of Pediatric Nurse Practitioners (NAPNAP) 46th National Conference on Pediatric Health Care. |
Pain Portfolio Highlights
| ● | Grew net revenues from pain portfolio to $149.2 million in the 2025 Quarter, up 3% year-over-year. |
| ● | Generated Belbuca® net revenue of $51.7 million, up 2% year-over-year. |
| ● | Generated Xtampza® ER net revenue of $47.6 million, up 4% year-over-year. |
| ● | Generated Nucynta® Franchise net revenue of $47.1 million, up 4% year-over-year. |
| ● | In April, presented four posters highlighting real-world patient data from the pain portfolio at PainConnect 2025, the American Academy of Pain Medicine (AAPM)’s Annual Meeting. One poster highlighting clinical outcomes with Belbuca was selected among the top six abstracts of the 2025 Congress and will subsequently be published in the Pain Medicine Journal. |
Corporate Updates
| ● | In February and March, announced updates to Collegium’s Board of Directors including the appointment of Gino Santini, the Board’s Lead Independent Director, to Chairman following the retirement of founder and current Chairman, Michael Heffernan, effective as of the date of Collegium’s 2025 Annual Meeting of Shareholders on May 15, 2025 (the Annual Meeting). Additionally, two new Board members and one retirement were announced; Nancy S. Lurker, who most recently served as President and Chief Executive Officer of EyePoint Pharmaceuticals, was appointed in February and Dr. Carlos Paya, a leading physician-scientist in immunology and a senior executive in the biopharmaceutical industry, was nominated for election to the Board at the Company’s Annual Meeting. Current Board member Gwen A. Melincoff will retire from the Board effective as of the date of the Annual Meeting after having dutifully served since 2017. |
| ● | In March, announced the appointments of three new executive leaders, including David Dieter as Executive Vice President, General Counsel; Jane Gonnerman as Executive Vice President, Strategy and Corporate Development; and Dean J. Patras, as Chief People Officer. |
| ● | Board of Directors authorized a $25.0 million accelerated share repurchase program. |
| ● | In March, named a Top Workplace by USA TODAY, a prestigious recognition highlighting organizations that are leading the way in prioritizing and investing in their employees in 2025. |
| ● | In April, named as a Best Places to Work honoree by the Boston Business Journal, a recognition of organizations that foster employee satisfaction, engagement, and retention. |
Upcoming Events
The Company will participate in the following upcoming investor conferences:
| ● | Mizuho Neuro & Ophthalmology Summit 2025 – New York, NY; May 21, 2025 |
| ● | Jefferies Global Healthcare Conference – New York, NY; June 5, 2025 |
Financial Guidance for 2025
The Company reaffirms its full-year 2025 guidance for Product Revenues, Net, Adjusted Operating Expenses and Adjusted EBITDA:
Product Revenues, Net | $735.0 to $750.0 million |
Adjusted Operating Expenses (Excluding Stock-Based Compensation) | $220.0 to $230.0 million |
Adjusted EBITDA (Excluding Stock-Based Compensation) | $435.0 to $450.0 million |
Financial Results for Quarter Ended March 31, 2025
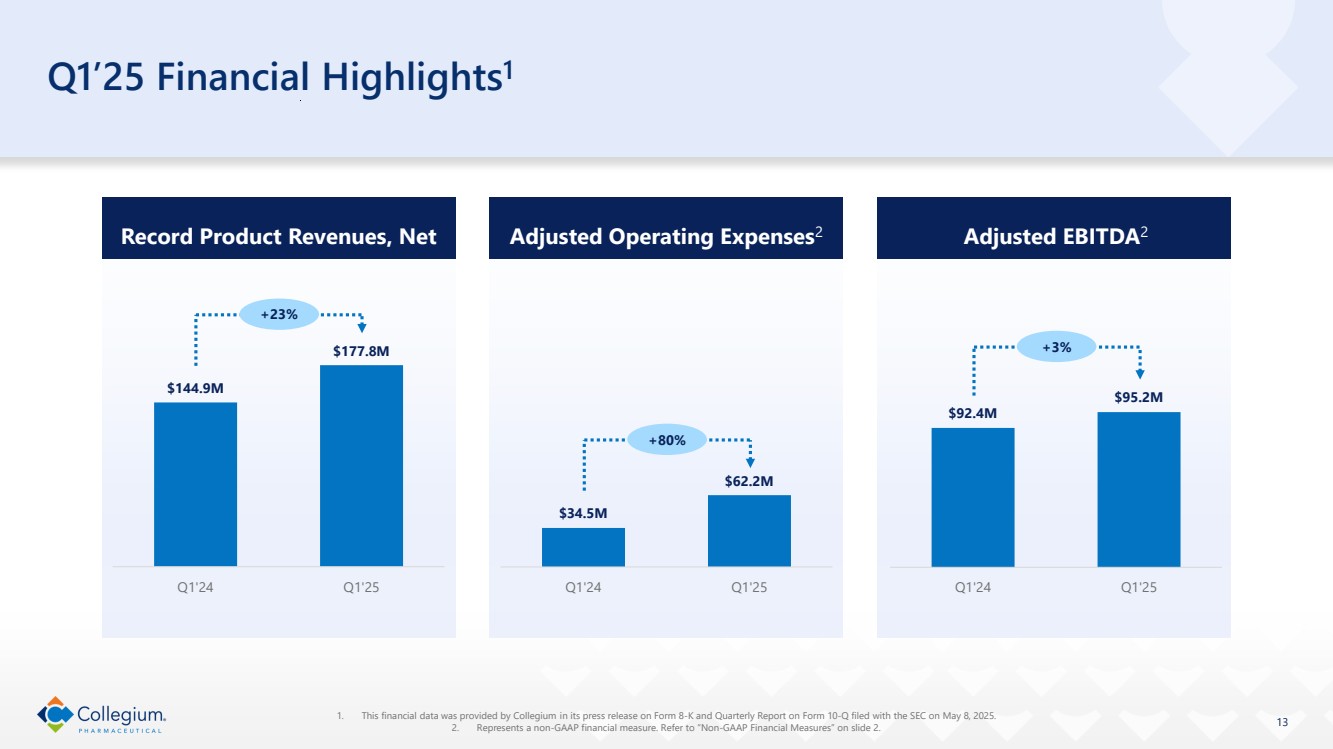
| ● | Product revenues, net were $177.8 million for the 2025 Quarter, compared to $144.9 million for the quarter ended March 31, 2024 (the 2024 Quarter), representing a 23% increase year-over-year. |
| ● | GAAP operating expenses were $75.6 million for the 2025 Quarter, compared to $42.0 million for the 2024 Quarter, representing an 80% increase year-over-year. Adjusted operating expenses, which exclude stock-based compensation expense and other adjustments to reflect changes that occur in our business but do not represent ongoing operations, were $62.2 million for the 2025 Quarter, compared to $34.5 million for the 2024 Quarter, representing an 80% increase year-over-year. |
| ● | GAAP net income for the 2025 Quarter was $2.4 million, with $0.08 GAAP earnings per share (basic) and $0.07 GAAP earnings per share (diluted), compared to GAAP net income for the 2024 Quarter of $27.7 million, with $0.86 GAAP earnings per share (basic) and $0.71 GAAP earnings per share (diluted). Non-GAAP adjusted net income for the 2025 Quarter was $57.4 million, with $1.49 adjusted earnings per share, compared to non-GAAP adjusted net income for the 2024 Quarter of $58.8 million, with $1.45 adjusted earnings per share. |
| ● | Adjusted EBITDA for the 2025 Quarter was $95.2 million, compared to $92.4 million for the 2024 Quarter, representing a 3% increase year-over-year. The Company generated $55.4 million in cash from operations, and exited the 2025 Quarter with cash, cash equivalents and marketable securities of $197.8 million, up from $162.8 million as of December 31, 2024. |
Conference Call Information
The Company will host a conference call and live audio webcast on Thursday, May 8, 2025, at 4:30 p.m. ET. To access the conference call, please dial (877) 407-8037 (U.S.) or (201) 689-8037 (International) and reference the “Collegium Pharmaceutical First Quarter 2025 Earnings Call.” An audio webcast will be accessible from the Investors section of the Company’s website: www.collegiumpharma.com. The webcast will be available for replay on the Company’s website approximately two hours after the event.
About Collegium Pharmaceutical, Inc.
Collegium is building a leading, diversified biopharmaceutical company committed to improving the lives of people living with serious medical conditions. The Company has a leading portfolio of responsible pain management medications and recently acquired Jornay PM®, a treatment for ADHD, establishing a presence in neuropsychiatry. Collegium’s strategy includes growing its commercial portfolio, with Jornay PM as the lead growth driver, and deploying capital in a disciplined manner. Collegium’s headquarters are located in Stoughton, Massachusetts. For more information, please visit the Company’s website at www.collegiumpharma.com.
Non-GAAP Financial Measures
To supplement our financial results presented on a GAAP basis, we have included information about certain non-GAAP financial measures. We believe the presentation of these non-GAAP financial measures, when viewed with our results under GAAP and the accompanying reconciliations, provide analysts, investors, lenders, and other third parties with insights into how we evaluate normal operational activities, including our ability to generate cash from operations, on a comparable year-over-year basis and manage our budgeting and forecasting. In addition, certain non-GAAP financial measures, primarily adjusted EBITDA, are used to measure performance when determining components of annual compensation for substantially all non-sales force employees, including senior management.
We may discuss the following financial measures that are not calculated in accordance with GAAP in our quarterly and annual reports, earnings press releases, and conference calls.
Adjusted EBITDA
Adjusted EBITDA is a non-GAAP financial measure that represents GAAP net income or loss adjusted to exclude interest expense, interest income, the benefit from or provision for income taxes, depreciation, amortization, stock-based compensation, and other adjustments to reflect changes that occur in our business but do not represent ongoing operations. Adjusted EBITDA, as used by us, may be calculated differently from, and therefore may not be comparable to, similarly titled measures used by other companies.
There are several limitations related to the use of adjusted EBITDA rather than net income or loss, which is the nearest GAAP equivalent, such as:
| ● | adjusted EBITDA excludes depreciation and amortization, and, although these are non-cash expenses, the assets being depreciated or amortized may have to be replaced in the future, the cash requirements for which are not reflected in adjusted EBITDA; |
| ● | adjusted EBITDA does not reflect changes in, or cash requirements for, working capital needs; |
| ● | adjusted EBITDA does not reflect the benefit from or provision for income taxes or the cash requirements to pay taxes; |
| ● | adjusted EBITDA does not reflect historical cash expenditures or future requirements for capital expenditures or contractual commitments; |
| ● | we exclude stock-based compensation expense from adjusted EBITDA although: (i) it has been, and will continue to be for the foreseeable future, a significant recurring expense for our business and an important part of our compensation strategy; and (ii) if we did not pay out a portion of our compensation in the form of stock-based compensation, the cash salary expense included in operating expenses would be higher, which would affect our cash position; |
| ● | we exclude impairment expenses from adjusted EBITDA and, although these are non-cash expenses, the asset(s) being impaired may have to be replaced in the future, the cash requirements for which are not reflected in adjusted EBITDA; |
| ● | we exclude restructuring expenses from adjusted EBITDA. Restructuring expenses primarily include employee severance and contract termination costs that are not related to acquisitions. The amount and/or frequency of these restructuring expenses are not part of our underlying business; |
| ● | we exclude litigation settlements from adjusted EBITDA, as well as any applicable income items or credit adjustments due to subsequent changes in estimates. This does not include our legal fees to defend claims, which are expensed as incurred; |
| ● | we exclude acquisition related expenses as the amount and/or frequency of these expenses are not part of our underlying business. Acquisition related expenses include transaction costs, which primarily consisted of financial advisory, banking, legal, and regulatory fees, and other consulting fees, incurred to complete the acquisition, employee-related expenses (severance cost and benefits) for terminated employees after the acquisition, and miscellaneous other acquisition related expenses incurred; |
| ● | we exclude recognition of the step-up basis in inventory from acquisitions (i.e., the adjustment to record inventory from historic cost to fair value at acquisition) as the adjustment does not reflect the ongoing expense associated with sale of our products as part of our underlying business; |
| ● | we exclude losses on extinguishments of debt as these expenses are episodic in nature and do not directly correlate to the cost of operating our business on an ongoing basis; |
| ● | we exclude executive transition expenses from adjusted EBITDA as the amount and/or frequency of these expenses are episodic in nature and do not directly correlate to the cost of operating our business on an ongoing basis; and |
| ● | we exclude other expenses, from time to time, that are episodic in nature and do not directly correlate to the cost of operating our business on an ongoing basis. |
Adjusted Operating Expenses
Adjusted operating expenses is a non-GAAP financial measure that represents GAAP operating expenses adjusted to exclude stock-based compensation expense, and other adjustments to reflect changes that occur in our business but do not represent ongoing operations.
Adjusted Net Income and Adjusted Earnings Per Share
Adjusted net income is a non-GAAP financial measure that represents GAAP net income or loss adjusted to exclude significant income and expense items that are non-cash or not indicative of ongoing operations, including consideration of the tax effect of the adjustments. Adjusted earnings per share is a non-GAAP financial measure that represents adjusted net income per share. Adjusted weighted-average shares - diluted is calculated in accordance with the treasury stock, if-converted, or contingently issuable accounting methods, depending on the nature of the security.
Reconciliations of adjusted EBITDA, adjusted operating expenses, adjusted net income, and adjusted earnings per share to the most directly comparable GAAP financial measures are included in this press release.
The Company has not provided a reconciliation of its full-year 2025 guidance for adjusted EBITDA or adjusted operating expenses to the most directly comparable forward-looking GAAP measures, in reliance on the unreasonable efforts exception provided under Item 10(e)(1)(i)(B) of Regulation S-K, because the Company is unable to predict, without unreasonable efforts, the timing and amount of items that would be included in such a reconciliation, including, but not limited to, stock-based compensation expense, acquisition related expense and litigation settlements. These items are uncertain and depend on various factors that are outside of the Company’s control or cannot be reasonably predicted. While the Company is unable to address the probable significance of these items, they could have a material impact on GAAP net income and operating expenses for the guidance period. A reconciliation of adjusted EBITDA or adjusted operating expenses would imply a degree of precision and certainty as to these future items that does not exist and could be confusing to investors.
Forward-Looking Statements
This press release contains forward-looking statements within the meaning of The Private Securities Litigation Reform Act of 1995. We may, in some cases, use terms such as "predicts," "forecasts," "believes," "potential," "proposed," "continue," "estimates," "anticipates," "expects," "plans," "intends," "may," "could," "might," "should" or other words that convey uncertainty of future events or outcomes to identify these forward-looking statements. Examples of forward-looking statements contained in this press release include, among others, statements related to our full-year 2025 financial guidance, including projected product revenue, adjusted operating expenses and adjusted EBITDA, current and future market opportunities for our products and our assumptions related thereto, expectations (financial or otherwise) and intentions, and other statements that are not historical facts. Such statements are subject to numerous important factors, risks and uncertainties that may cause actual events or results, performance, or achievements to differ materially from the company's current expectations, including risks relating to, among others: unknown liabilities; risks related to future opportunities and plans for our products, including uncertainty of the expected financial performance of such products; our ability to commercialize and grow sales of our products; our ability to manage our relationships with licensors; the success of competing products that are or become available; our ability to maintain regulatory approval of our products, and any related restrictions, limitations, and/or warnings in the label of our products; the size of the markets for our products, and our ability to service those markets; our ability to obtain reimbursement and third-party payor contracts for our products; the rate and degree of market acceptance of our products; the costs of commercialization activities, including marketing, sales and distribution; changing market conditions for our products; the outcome of any patent infringement or other litigation that may be brought by or against us; the outcome of any governmental investigation related to our business; our ability to secure adequate supplies of active pharmaceutical ingredient for each of our products and manufacture adequate supplies of commercially saleable inventory; our ability to obtain funding for our operations and business development; regulatory developments in the U.S.; our expectations regarding our ability to obtain and maintain sufficient intellectual property protection for our products; our ability to comply with stringent U.S. and foreign government regulation in the manufacture of pharmaceutical products, including U.S. Drug Enforcement Agency compliance; our customer concentration; and the accuracy of our estimates regarding expenses, revenue, capital requirements and need for additional financing. These and other risks are described under the heading "Risk Factors" in our Annual Reports on Form 10-K and Quarterly Reports on Form 10-Q and other filings with the SEC. Any forward-looking statements that we make in this press release speak only as of the date of this press release. We assume no obligation to update our forward-looking statements whether as a result of new information, future events or otherwise, after the date of this press release.
Investor Contacts:
Ian Karp
Head of Investor Relations
ir@collegiumpharma.com
Danielle Jesse
Director, Investor Relations
ir@collegiumpharma.com
Media Contact:
Cheryl Wheeler
Head of Corporate Communications
communications@collegiumpharma.com
Collegium Pharmaceutical, Inc.
Unaudited Selected Consolidated Balance Sheet Information
(in thousands)
| | March 31, | | December 31, | ||
|
| 2025 | | 2024 | ||
Cash and cash equivalents | | $ | 96,192 | | $ | 70,565 |
Marketable securities | | | 101,582 | | | 92,198 |
Accounts receivable, net | |
| 228,710 | | | 228,540 |
Inventory | |
| 37,218 | | | 35,560 |
Prepaid expenses and other current assets | |
| 43,996 | | | 30,394 |
Property and equipment, net | | | 13,850 | | | 14,329 |
Operating lease assets | |
| 5,545 | | | 5,822 |
Intangible assets, net | |
| 835,930 | | | 891,402 |
Restricted cash | |
| 20,902 | | | 26,047 |
Deferred tax assets | | | 91,665 | | | 98,033 |
Other noncurrent assets | |
| 5,038 | | | 8,368 |
Goodwill | | | 150,760 | | | 162,333 |
Total assets | | $ | 1,631,388 | | $ | 1,663,591 |
| | | | | | |
Accounts payable and accrued liabilities | |
| 71,593 | | | 76,058 |
Accrued rebates, returns and discounts | |
| 324,665 | | | 338,642 |
Business combination consideration payable | | | 24,565 | | | 28,956 |
Term notes payable | |
| 600,281 | | | 615,316 |
Convertible senior notes | | | 237,429 | | | 237,172 |
Operating lease liabilities | |
| 6,503 | | | 6,810 |
Deferred royalty obligation | | | 121,522 | | | 120,613 |
Deferred revenue | | | 10,000 | | | 10,000 |
Contingent consideration | | | 396 | | | 1,182 |
Shareholders’ equity | |
| 234,434 | | | 228,842 |
Total liabilities and shareholders’ equity | | $ | 1,631,388 | | $ | 1,663,591 |
Collegium Pharmaceutical, Inc.
Unaudited Condensed Statements of Operations
(in thousands, except share and per share amounts)
| Three Months Ended March 31, | ||||
| 2025 | | 2024 | ||
Product revenues, net | $ | 177,757 | | $ | 144,923 |
Cost of product revenues | | | | | |
Cost of product revenues (excluding intangible asset amortization) | | 24,960 | | | 18,950 |
Intangible asset amortization and impairment | | 55,473 | | | 34,517 |
Total cost of product revenues |
| 80,433 | |
| 53,467 |
Gross profit | | 97,324 | | | 91,456 |
Operating expenses | | | | | |
Selling, general and administrative |
| 76,423 | |
| 41,982 |
Gain on fair value remeasurement of contingent consideration | | (786) | | | — |
Total operating expenses |
| 75,637 | |
| 41,982 |
Income from operations |
| 21,687 | |
| 49,474 |
Interest expense |
| (20,790) | |
| (17,339) |
Interest income | | 2,225 | | | 4,487 |
Income before income taxes | | 3,122 | | | 36,622 |
Provision for income taxes | | 705 | | | 8,909 |
Net income | $ | 2,417 | | $ | 27,713 |
| | | | | |
Earnings per share — basic | $ | 0.08 | | $ | 0.86 |
Weighted-average shares — basic | | 31,793,739 | | | 32,326,589 |
| | | | | |
Earnings per share — diluted | $ | 0.07 | | $ | 0.71 |
Weighted-average shares — diluted | | 32,840,153 | | | 41,438,466 |
Collegium Pharmaceutical, Inc.
Reconciliation of GAAP Net Income to Adjusted EBITDA
(in thousands)
(unaudited)
| Three Months Ended March 31, | ||||
| 2025 | | 2024 | ||
GAAP net income | $ | 2,417 | | $ | 27,713 |
Adjustments: | | | | | |
Interest expense | | 20,790 | | | 17,339 |
Interest income | | (2,225) | | | (4,487) |
Provision for income taxes | | 705 | | | 8,909 |
Depreciation | | 1,091 | | | 917 |
Amortization | | 55,473 | | | 34,517 |
Stock-based compensation | | 11,524 | | | 7,475 |
Recognition of step-up basis in inventory | | 3,477 | | | — |
Executive transition expense | | 1,397 | | | — |
Acquisition related expenses | | 1,289 | | | — |
Gain on fair value remeasurement of contingent consideration | | (786) | | | — |
Total adjustments | $ | 92,735 | | $ | 64,670 |
Adjusted EBITDA | $ | 95,152 | | $ | 92,383 |
Collegium Pharmaceutical, Inc.
Reconciliation of GAAP Operating Expenses to Adjusted Operating Expenses
(in thousands)
(unaudited)
| Three Months Ended March 31, | ||||
| 2025 | | 2024 | ||
GAAP operating expenses | $ | 75,637 | | $ | 41,982 |
Adjustments: | | | | | |
Stock-based compensation | | 11,524 | | | 7,475 |
Executive transition expense | | 1,397 | | | — |
Acquisition related expenses | | 1,289 | | | — |
Gain on fair value remeasurement of contingent consideration | | (786) | | | — |
Total adjustments | $ | 13,424 | | $ | 7,475 |
Adjusted operating expenses | $ | 62,213 | | $ | 34,507 |
Collegium Pharmaceutical, Inc.
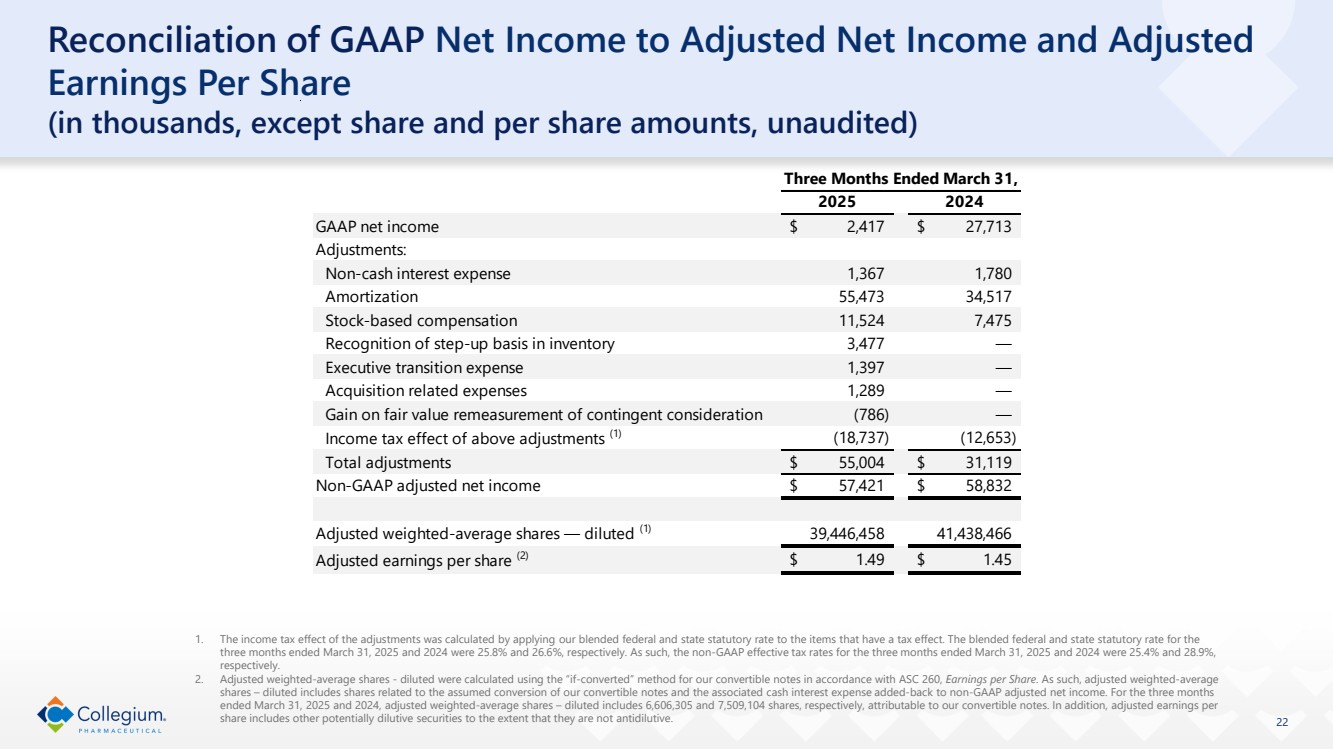
Reconciliation of GAAP Net Income to Adjusted Net Income and Adjusted Earnings Per Share
(in thousands, except share and per share amounts)
(unaudited)
| Three Months Ended March 31, | ||||
| 2025 | | 2024 | ||
GAAP net income | $ | 2,417 | | $ | 27,713 |
Adjustments: | | | | | |
Non-cash interest expense | | 1,367 | | | 1,780 |
Amortization | | 55,473 | | | 34,517 |
Stock-based compensation | | 11,524 | | | 7,475 |
Recognition of step-up basis in inventory | | 3,477 | | | — |
Executive transition expense | | 1,397 | | | — |
Acquisition related expenses | | 1,289 | | | — |
Gain on fair value remeasurement of contingent consideration | | (786) | | | — |
Income tax effect of above adjustments (1) | | (18,737) | | | (12,653) |
Total adjustments | $ | 55,004 | | $ | 31,119 |
Non-GAAP adjusted net income | $ | 57,421 | | $ | 58,832 |
| | | | | |
Adjusted weighted-average shares — diluted (2) | | 39,446,458 | | | 41,438,466 |
Adjusted earnings per share (2) | $ | 1.49 | | $ | 1.45 |
(1) | The income tax effect of the adjustments was calculated by applying our blended federal and state statutory rate to the items that have a tax effect. The blended federal and state statutory rate for the three months ended March 31, 2025 and 2024 were 25.8% and 26.6%, respectively. As such, the non-GAAP effective tax rates for the three months ended March 31, 2025 and 2024 were 25.4% and 28.9%, respectively. |
(2) | Adjusted weighted-average shares - diluted were calculated using the “if-converted” method for our convertible notes in accordance with ASC 260, Earnings per Share. As such, adjusted weighted-average shares – diluted includes shares related to the assumed conversion of our convertible notes and the associated cash interest expense added-back to non-GAAP adjusted net income. For the three months ended March 31, 2025 and 2024, adjusted weighted-average shares – diluted includes 6,606,305 and 7,509,104 shares, respectively, attributable to our convertible notes. In addition, adjusted earnings per share includes other potentially dilutive securities to the extent that they are not antidilutive. |
| Q1 2025 Earnings Report May 8, 2025 | Nasdaq: COLL Healthier people. Stronger communities. |

| Forward-Looking Statements This presentation contains forward-looking statements within the meaning of The Private Securities Litigation Reform Act of 1995. We may, in some cases, use terms such as "predicts," "forecasts," "believes," "potential," "proposed," "continue," "estimates," "anticipates," "expects," "plans," "intends," "may," "could," "might," "should" or other words that convey uncertainty of future events or outcomes to identify these forward-looking statements. Examples of forward-looking statements contained in this presentation include, among others, statements related to our full-year 2025 financial guidance, including projected product revenue, adjusted operating expenses and adjusted EBITDA, current and future market opportunities for our products and our assumptions related thereto, expectations (financial or otherwise) and intentions, and other statements that are not historical facts. Such statements are subject to numerous important factors, risks and uncertainties that may cause actual events or results, performance, or achievements to differ materially from the company's current expectations, including risks relating to, among others: unknown liabilities; risks related to future opportunities and plans for our products, including uncertainty of the expected financial performance of such products; our ability to commercialize and grow sales of our products; our ability to manage our relationships with licensors; the success of competing products that are or become available; our ability to maintain regulatory approval of our products, and any related restrictions, limitations, and/or warnings in the label of our products; the size of the markets for our products, and our ability to service those markets; our ability to obtain reimbursement and third-party payor contracts for our products; the rate and degree of market acceptance of our products; the costs of commercialization activities, including marketing, sales and distribution; changing market conditions for our products; the outcome of any patent infringement or other litigation that may be brought by or against us; the outcome of any governmental investigation related to our business; our ability to secure adequate supplies of active pharmaceutical ingredient for each of our products and manufacture adequate supplies of commercially saleable inventory; our ability to obtain funding for our operations and business development; regulatory developments in the U.S.; our expectations regarding our ability to obtain and maintain sufficient intellectual property protection for our products; our ability to comply with stringent U.S. and foreign government regulation in the manufacture of pharmaceutical products, including U.S. Drug Enforcement Agency compliance; our customer concentration; and the accuracy of our estimates regarding expenses, revenue, capital requirements and need for additional financing. These and other risks are described under the heading "Risk Factors" in our Annual Reports on Form 10-K and Quarterly Reports on Form 10-Q and other filings with the SEC. Any forward-looking statements that we make in this presentation speak only as of the date of this presentation. We assume no obligation to update our forward-looking statements whether as a result of new information, future events or otherwise, after the date of this presentation. Non-GAAP Financial Measures To supplement our financial results presented on a GAAP basis, we have included information about certain non-GAAP financial measures. We believe the presentation of these non-GAAP financial measures, when viewed with our results under GAAP and the accompanying reconciliations, provide analysts, investors, lenders, and other third parties with insights into how we evaluate normal operational activities, including our ability to generate cash from operations, on a comparable year-over-year basis and manage our budgeting and forecasting. In addition, certain non-GAAP financial measures, primarily Adjusted EBITDA, are used to measure performance when determining components of annual compensation for substantially all non-sales force employees, including senior management. In this presentation, we discuss the following financial measures that are not calculated in accordance with GAAP, to supplement our consolidated financial statements presented on a GAAP basis. Adjusted EBITDA Adjusted EBITDA is a non-GAAP financial measure that represents GAAP net income or loss adjusted to exclude interest expense, interest income, the benefit from or provision for income taxes, depreciation, amortization, stock-based compensation, and other adjustments to reflect changes that occur in our business but do not represent ongoing operations. Adjusted EBITDA, as used by us, may be calculated differently from, and therefore may not be comparable to, similarly titled measures used by other companies. There are several limitations related to the use of adjusted EBITDA rather than net income or loss, which is the nearest GAAP equivalent, such as: • adjusted EBITDA excludes depreciation and amortization, and, although these are non-cash expenses, the assets being depreciated or amortized may have to be replaced in the future, the cash requirements for which are not reflected in adjusted EBITDA; • adjusted EBITDA does not reflect changes in, or cash requirements for, working capital needs; • adjusted EBITDA does not reflect the benefit from or provision for income taxes or the cash requirements to pay taxes; • adjusted EBITDA does not reflect historical cash expenditures or future requirements for capital expenditures or contractual commitments; • we exclude stock-based compensation expense from adjusted EBITDA although: (i) it has been, and will continue to be for the foreseeable future, a significant recurring expense for our business and an important part of our compensation strategy; and (ii) if we did not pay out a portion of our compensation in the form of stock-based compensation, the cash salary expense included in operating expenses would be higher, which would affect our cash position; • we exclude impairment expenses from adjusted EBITDA and, although these are non-cash expenses, the asset(s) being impaired may have to be replaced in the future, the cash requirements for which are not reflected in adjusted EBITDA; • we exclude restructuring expenses from adjusted EBITDA. Restructuring expenses primarily include employee severance and contract termination costs that are not related to acquisitions. The amount and/or frequency of these restructuring expenses are not part of our underlying business; • we exclude litigation settlements from adjusted EBITDA, as well as any applicable income items or credit adjustments due to subsequent changes in estimates. This does not include our legal fees to defend claims, which are expensed as incurred; • we exclude acquisition related expenses as the amount and/or frequency of these expenses are not part of our underlying business. Acquisition related expenses include transaction costs, which primarily consisted of financial advisory, banking, legal, and regulatory fees, and other consulting fees, incurred to complete the acquisition, employee-related expenses (severance cost and benefits) for terminated employees after the acquisition, and miscellaneous other acquisition related expenses incurred; • we exclude recognition of the step-up basis in inventory from acquisitions (i.e., the adjustment to record inventory from historic cost to fair value at acquisition) as the adjustment does not reflect the ongoing expense associated with sale of our products as part of our underlying business; • we exclude losses on extinguishments of debt as these expenses are episodic in nature and do not directly correlate to the cost of operating our business on an ongoing basis; • we exclude executive transition expenses from adjusted EBITDA as the amount and/or frequency of these expenses are episodic in nature and do not directly correlate to the cost of operating our business on an ongoing basis; and • we exclude other expenses, from time to time, that are episodic in nature and do not directly correlate to the cost of operating our business on an ongoing basis. Adjusted Operating Expenses Adjusted operating expenses is a non-GAAP financial measure that represents GAAP operating expenses adjusted to exclude stock-based compensation expense, and other adjustments to reflect changes that occur in our business but do not represent ongoing operations. Adjusted Net Income and Adjusted Earnings Per Share Adjusted net income is a non-GAAP financial measure that represents GAAP net income or loss adjusted to exclude significant income and expense items that are non-cash or not indicative of ongoing operations, including consideration of the tax effect of the adjustments. Adjusted earnings per share is a non-GAAP financial measure that represents adjusted net income per share. Adjusted weighted-average shares - diluted is calculated in accordance with the treasury stock, if-converted, or contingently issuable accounting methods, depending on the nature of the security. Reconciliations of adjusted EBITDA and adjusted operating expenses to the most directly comparable GAAP financial measures are included in this presentation. The Company has not provided a reconciliation of its full-year 2025 guidance for adjusted EBITDA or adjusted operating expenses to the most directly comparable forward-looking GAAP measures, in reliance on the unreasonable efforts exception provided under Item 10(e)(1)(i)(B) of Regulation S-K, because the Company is unable to predict, without unreasonable efforts, the timing and amount of items that would be included in such a reconciliation, including, but not limited to, stock-based compensation expense, acquisition related expense and litigation settlements. These items are uncertain and depend on various factors that are outside of the Company’s control or cannot be reasonably predicted. While the Company is unable to address the probable significance of these items, they could have a material impact on GAAP net income and operating expenses for the guidance period. A reconciliation of adjusted EBITDA or adjusted operating expenses would imply a degree of precision and certainty as to these future items that does not exist and could be confusing to investors. |
| Business Update Vikram Karnani President & Chief Executive Officer |

| 4 Healthier people. Stronger communities. Building a leading, diversified biopharmaceutical company committed to improving the lives of people living with serious medical conditions. |

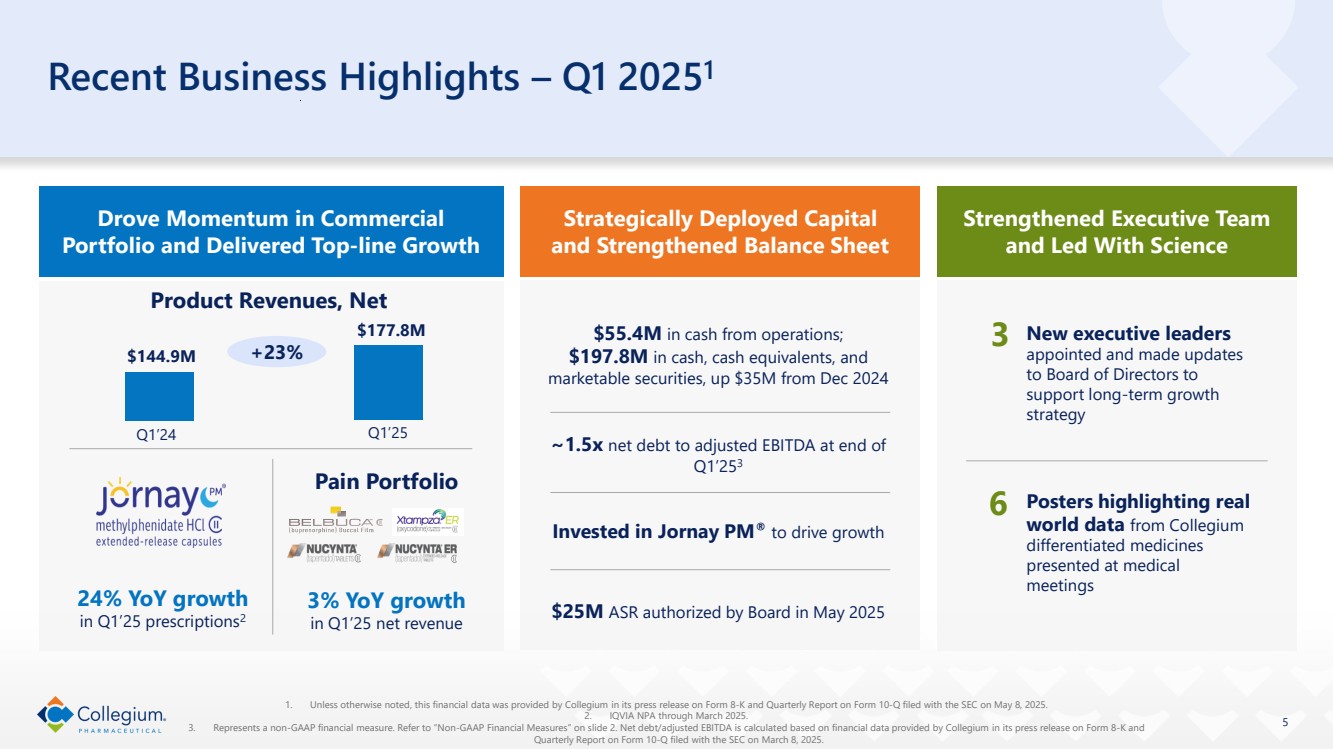
| 5 Recent Business Highlights – Q1 20251 Drove Momentum in Commercial Portfolio and Delivered Top-line Growth 1. Unless otherwise noted, this financial data was provided by Collegium in its press release on Form 8-K and Quarterly Report on Form 10-Q filed with the SEC on May 8, 2025. 2. IQVIA NPA through March 2025. 3. Represents a non-GAAP financial measure. Refer to “Non-GAAP Financial Measures” on slide 2. Net debt/adjusted EBITDA is calculated based on financial data provided by Collegium in its press release on Form 8-K and Quarterly Report on Form 10-Q filed with the SEC on March 8, 2025. 24% YoY growth in Q1’25 prescriptions2 3% YoY growth in Q1’25 net revenue Pain Portfolio Strengthened Executive Team and Led With Science Strategically Deployed Capital and Strengthened Balance Sheet Product Revenues, Net $144.9M Q1’24 New executive leaders appointed and made updates to Board of Directors to support long-term growth strategy Posters highlighting real world data from Collegium differentiated medicines presented at medical meetings 3 6 $177.8M Q1’25 +23% $55.4M in cash from operations; $197.8M in cash, cash equivalents, and marketable securities, up $35M from Dec 2024 ~1.5x net debt to adjusted EBITDA at end of Q1’253 Invested in Jornay PM® to drive growth $25M ASR authorized by Board in May 2025 |
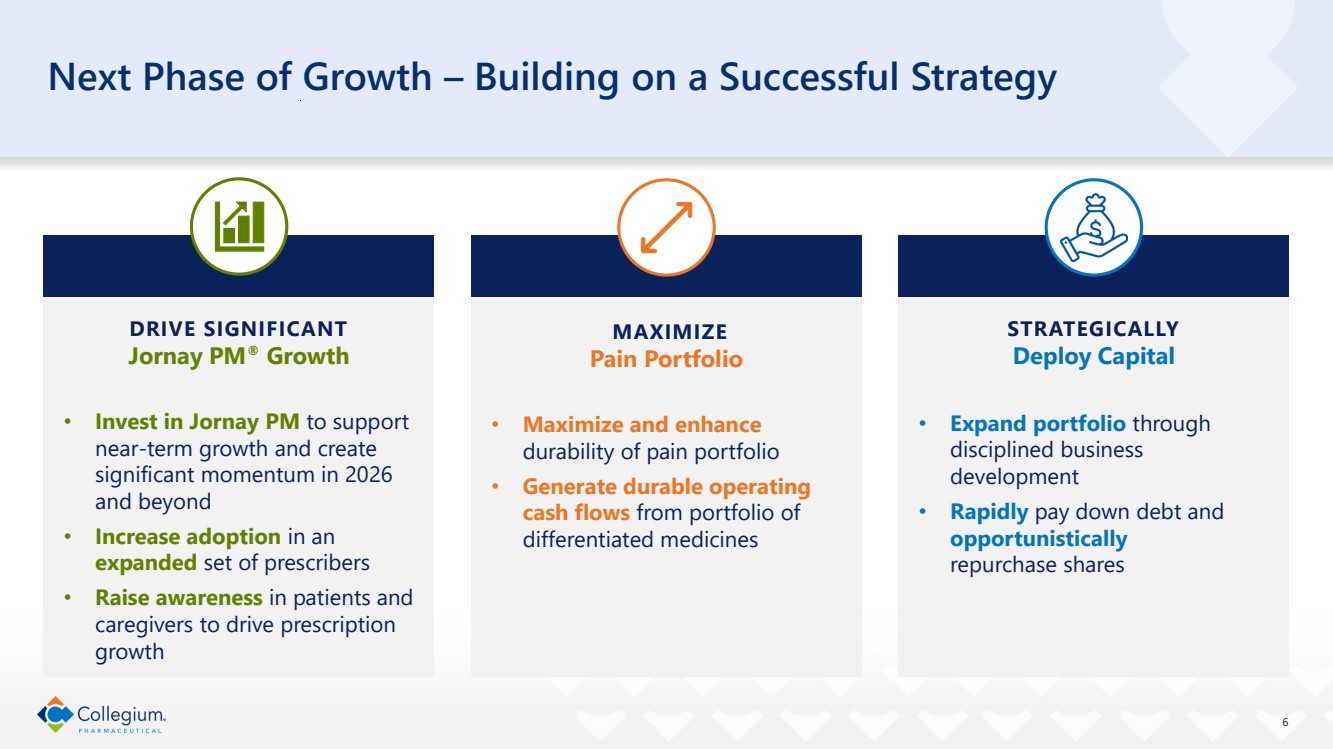
| DRIVE SIGNIFICANT Jornay PM® Growth • Invest in Jornay PM to support near-term growth and create significant momentum in 2026 and beyond • Increase adoption in an expanded set of prescribers • Raise awareness in patients and caregivers to drive prescription growth 6 Next Phase of Growth – Building on a Successful Strategy STRATEGICALLY Deploy Capital • Expand portfolio through disciplined business development • Rapidly pay down debt and opportunistically repurchase shares MAXIMIZE Pain Portfolio • Maximize and enhance durability of pain portfolio • Generate durable operating cash flows from portfolio of differentiated medicines |
| Commercial Update Scott Dreyer Executive Vice President & Chief Commercial Officer |

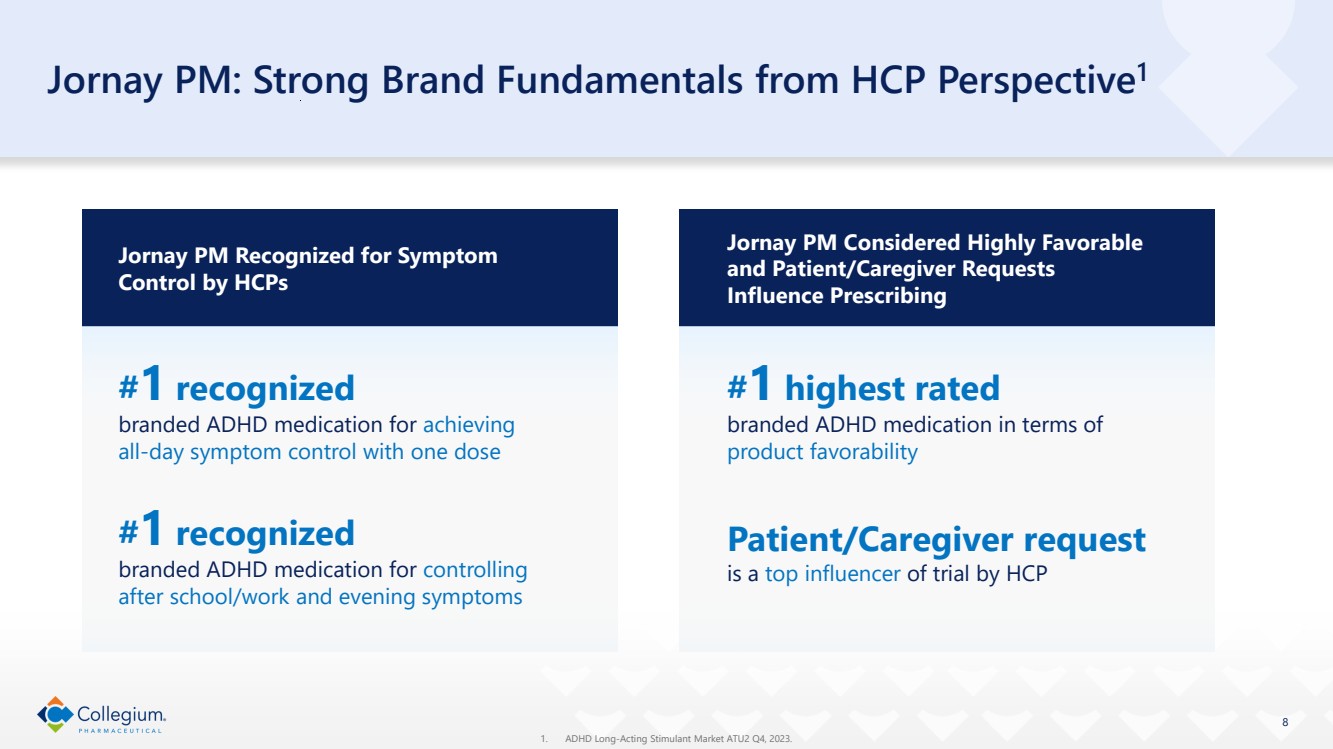
| Jornay PM Recognized for Symptom Control by HCPs 8 Jornay PM: Strong Brand Fundamentals from HCP Perspective1 1. ADHD Long-Acting Stimulant Market ATU2 Q4, 2023. Jornay PM Considered Highly Favorable and Patient/Caregiver Requests Influence Prescribing #1 recognized branded ADHD medication for achieving all-day symptom control with one dose #1 recognized branded ADHD medication for controlling after school/work and evening symptoms #1 highest rated branded ADHD medication in terms of product favorability Patient/Caregiver request is a top influencer of trial by HCP |
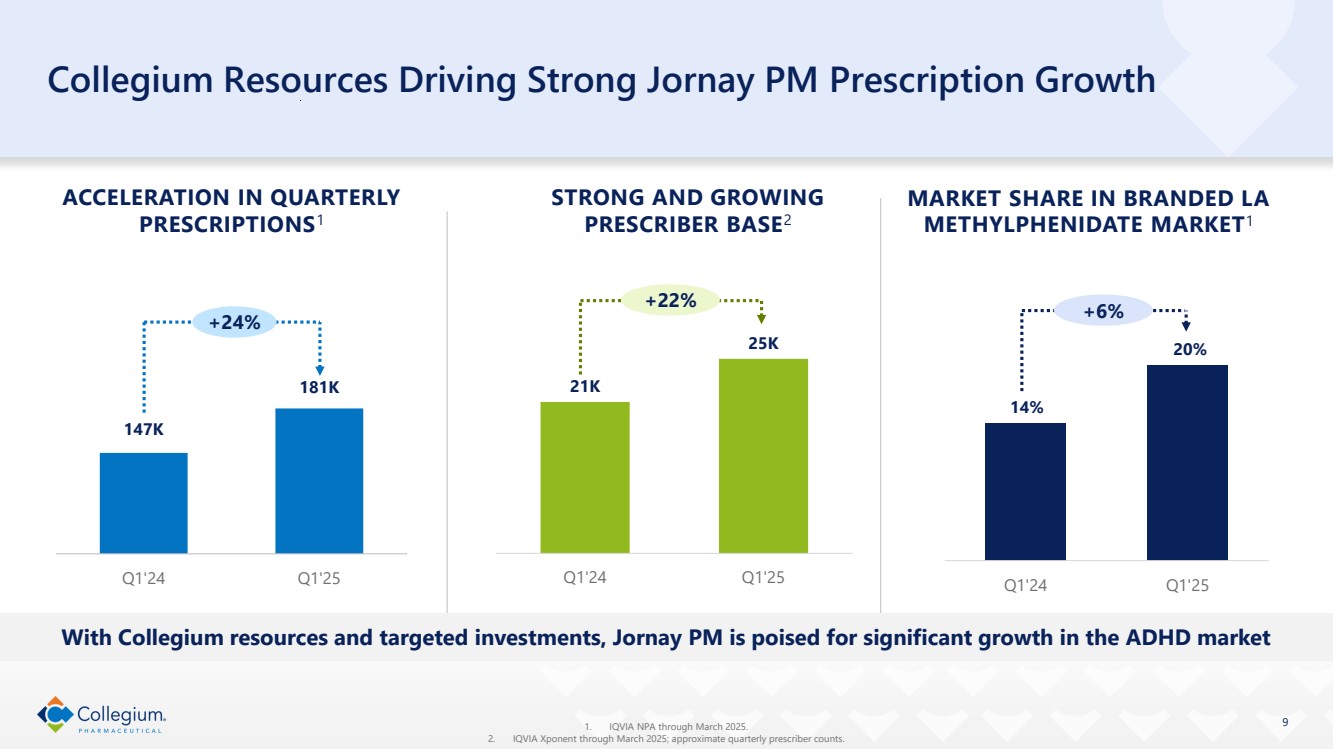
| 14% 20% Q1'24 Q1'25 9 Collegium Resources Driving Strong Jornay PM Prescription Growth STRONG AND GROWING PRESCRIBER BASE2 ACCELERATION IN QUARTERLY PRESCRIPTIONS1 21K 25K Q1'24 Q1'25 +22% 1. IQVIA NPA through March 2025. 2. IQVIA Xponent through March 2025; approximate quarterly prescriber counts. With Collegium resources and targeted investments, Jornay PM is poised for significant growth in the ADHD market MARKET SHARE IN BRANDED LA METHYLPHENIDATE MARKET1 +6% 147K 181K Q1'24 Q1'25 +24% |
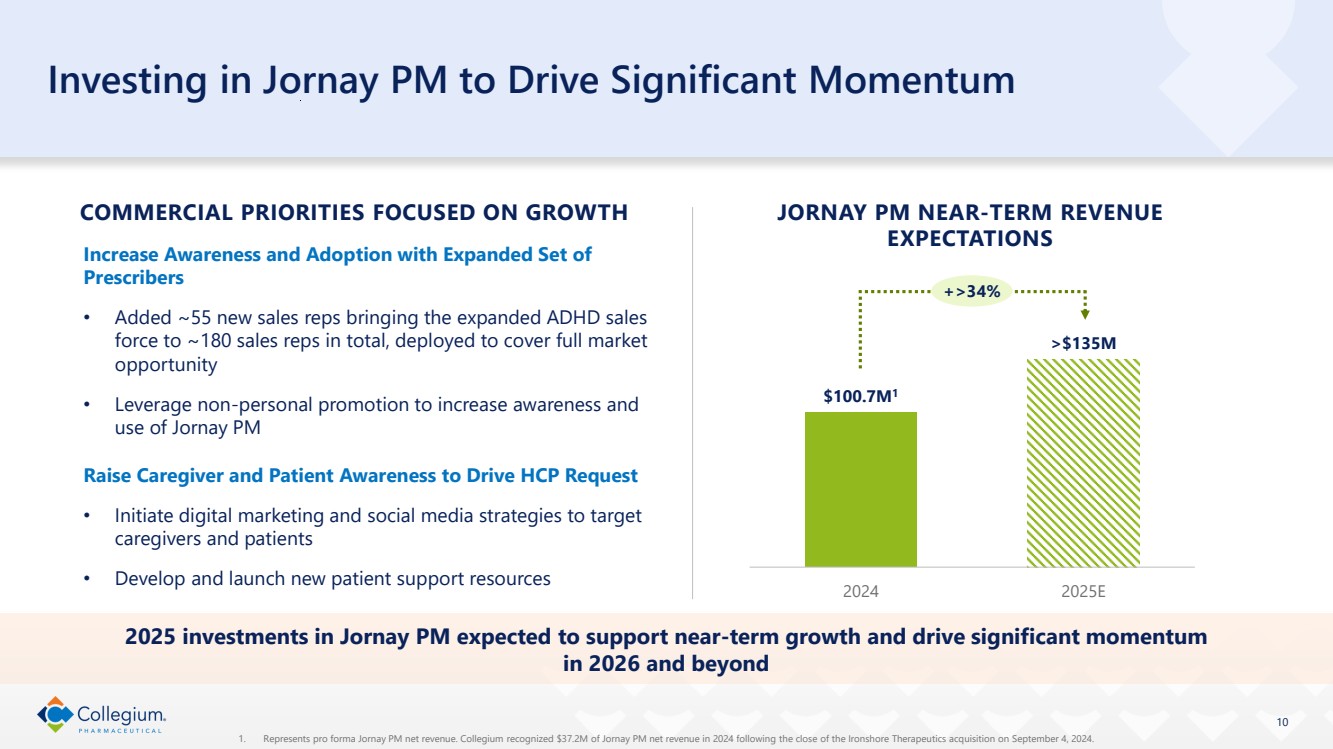
| 10 Investing in Jornay PM to Drive Significant Momentum Increase Awareness and Adoption with Expanded Set of Prescribers • Added ~55 new sales reps bringing the expanded ADHD sales force to ~180 sales reps in total, deployed to cover full market opportunity • Leverage non-personal promotion to increase awareness and use of Jornay PM Raise Caregiver and Patient Awareness to Drive HCP Request • Initiate digital marketing and social media strategies to target caregivers and patients • Develop and launch new patient support resources $100.7M1 >$135M 2024 2025E JORNAY PM NEAR-TERM REVENUE EXPECTATIONS COMMERCIAL PRIORITIES FOCUSED ON GROWTH 2025 investments in Jornay PM expected to support near-term growth and drive significant momentum in 2026 and beyond +>34% 1. Represents pro forma Jornay PM net revenue. Collegium recognized $37.2M of Jornay PM net revenue in 2024 following the close of the Ironshore Therapeutics acquisition on September 4, 2024. |
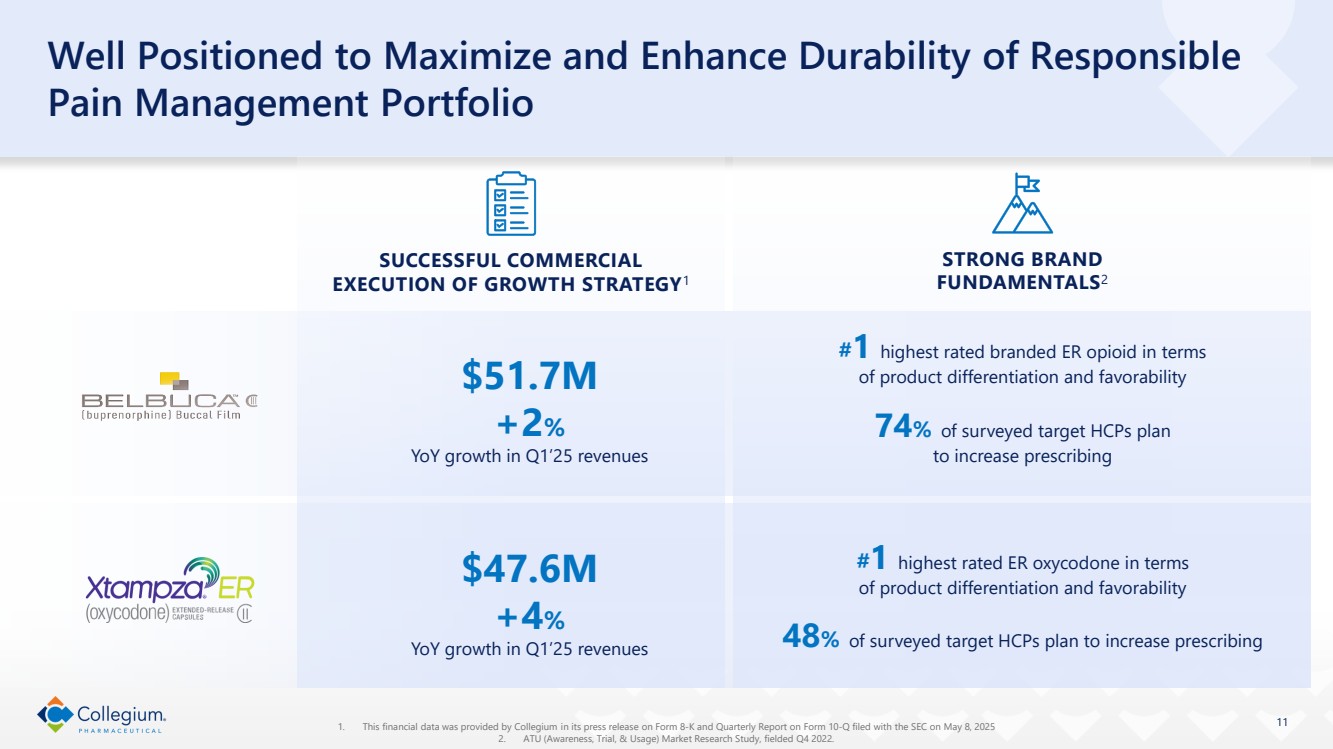
| 11 Well Positioned to Maximize and Enhance Durability of Responsible Pain Management Portfolio 1. This financial data was provided by Collegium in its press release on Form 8-K and Quarterly Report on Form 10-Q filed with the SEC on May 8, 2025 2. ATU (Awareness, Trial, & Usage) Market Research Study, fielded Q4 2022. #1 highest rated branded ER opioid in terms of product differentiation and favorability 74% of surveyed target HCPs plan to increase prescribing STRONG BRAND FUNDAMENTALS2 #1 highest rated ER oxycodone in terms of product differentiation and favorability 48% of surveyed target HCPs plan to increase prescribing SUCCESSFUL COMMERCIAL EXECUTION OF GROWTH STRATEGY1 $47.6M +4% YoY growth in Q1’25 revenues $51.7M +2% YoY growth in Q1’25 revenues |
| Financial Highlights Colleen Tupper Executive Vice President & Chief Financial Officer |

| Q1’25 Financial Highlights1 Record Product Revenues, Net $144.9M $177.8M Q1'24 Q1'25 +23% Adjusted Operating Expenses2 $34.5M $62.2M Q1'24 Q1'25 +80% Adjusted EBITDA2 $92.4M $95.2M Q1'24 Q1'25 +3% 13 1. This financial data was provided by Collegium in its press release on Form 8-K and Quarterly Report on Form 10-Q filed with the SEC on May 8, 2025. 2. Represents a non-GAAP financial measure. Refer to “Non-GAAP Financial Measures” on slide 2. |
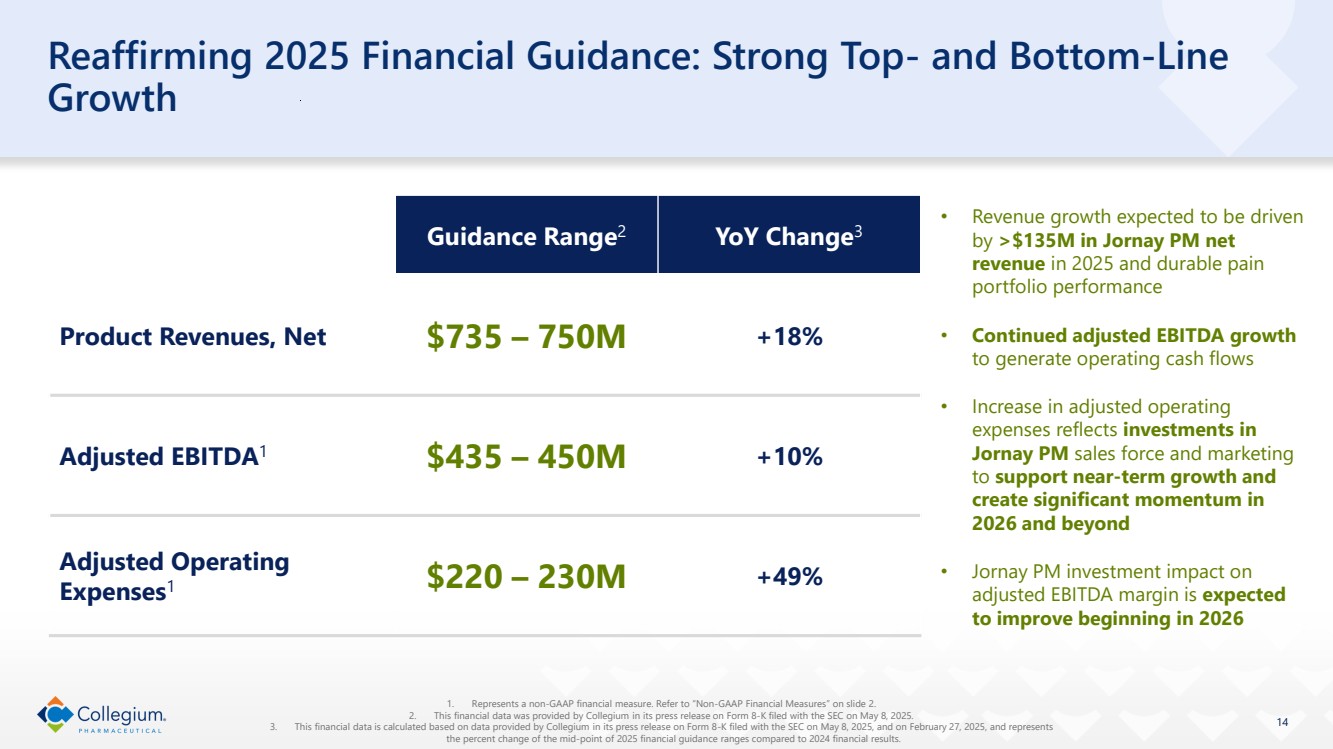
| Reaffirming 2025 Financial Guidance: Strong Top- and Bottom-Line Growth 1. Represents a non-GAAP financial measure. Refer to “Non-GAAP Financial Measures” on slide 2. 2. This financial data was provided by Collegium in its press release on Form 8-K filed with the SEC on May 8, 2025. 3. This financial data is calculated based on data provided by Collegium in its press release on Form 8-K filed with the SEC on May 8, 2025, and on February 27, 2025, and represents the percent change of the mid-point of 2025 financial guidance ranges compared to 2024 financial results. 14 Guidance Range2 YoY Change3 Product Revenues, Net $735 – 750M +18% Adjusted EBITDA1 $435 – 450M +10% Adjusted Operating Expenses1 $220 – 230M +49% • Revenue growth expected to be driven by >$135M in Jornay PM net revenue in 2025 and durable pain portfolio performance • Continued adjusted EBITDA growth to generate operating cash flows • Increase in adjusted operating expenses reflects investments in Jornay PM sales force and marketing to support near-term growth and create significant momentum in 2026 and beyond • Jornay PM investment impact on adjusted EBITDA margin is expected to improve beginning in 2026 |
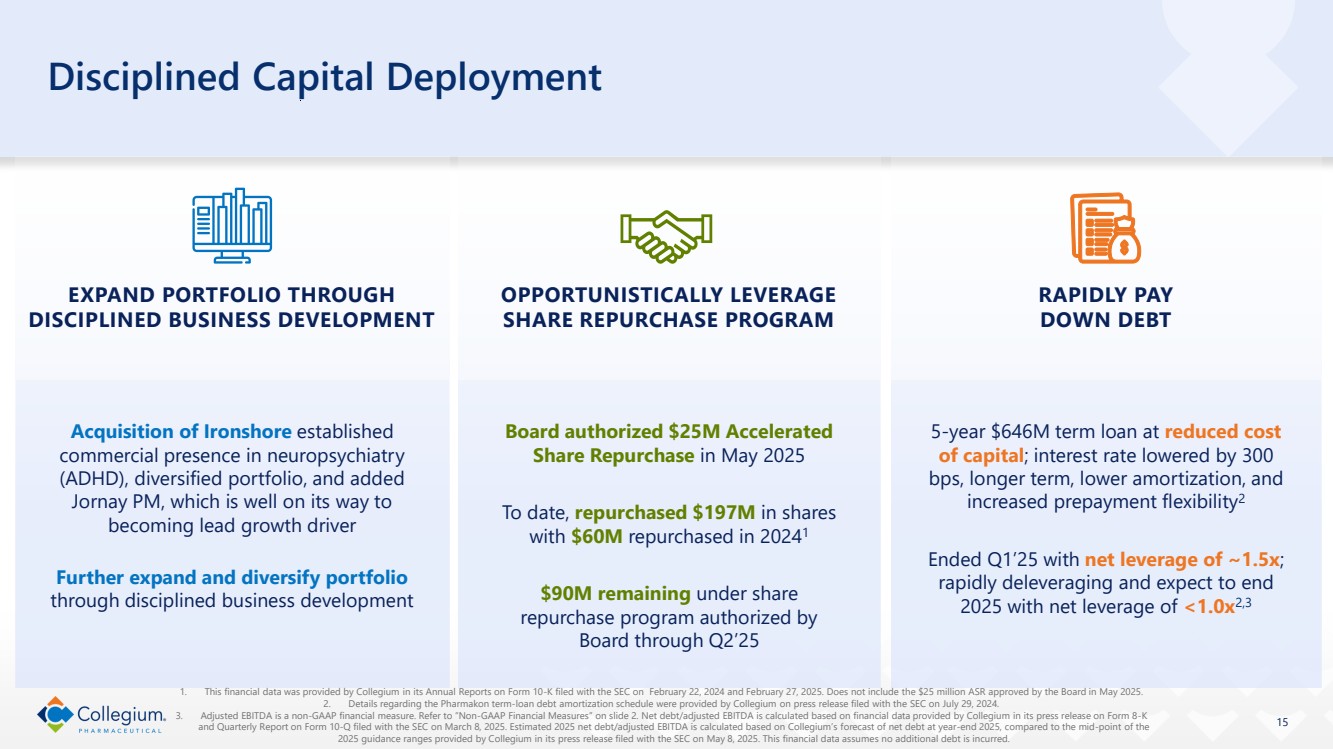
| Disciplined Capital Deployment 15 1. This financial data was provided by Collegium in its Annual Reports on Form 10-K filed with the SEC on February 22, 2024 and February 27, 2025. Does not include the $25 million ASR approved by the Board in May 2025. 2. Details regarding the Pharmakon term-loan debt amortization schedule were provided by Collegium on press release filed with the SEC on July 29, 2024. 3. Adjusted EBITDA is a non-GAAP financial measure. Refer to “Non-GAAP Financial Measures” on slide 2. Net debt/adjusted EBITDA is calculated based on financial data provided by Collegium in its press release on Form 8-K and Quarterly Report on Form 10-Q filed with the SEC on March 8, 2025. Estimated 2025 net debt/adjusted EBITDA is calculated based on Collegium’s forecast of net debt at year-end 2025, compared to the mid-point of the 2025 guidance ranges provided by Collegium in its press release filed with the SEC on May 8, 2025. This financial data assumes no additional debt is incurred. EXPAND PORTFOLIO THROUGH DISCIPLINED BUSINESS DEVELOPMENT Acquisition of Ironshore established commercial presence in neuropsychiatry (ADHD), diversified portfolio, and added Jornay PM, which is well on its way to becoming lead growth driver Further expand and diversify portfolio through disciplined business development OPPORTUNISTICALLY LEVERAGE SHARE REPURCHASE PROGRAM Board authorized $25M Accelerated Share Repurchase in May 2025 To date, repurchased $197M in shares with $60M repurchased in 20241 $90M remaining under share repurchase program authorized by Board through Q2’25 RAPIDLY PAY DOWN DEBT 5-year $646M term loan at reduced cost of capital; interest rate lowered by 300 bps, longer term, lower amortization, and increased prepayment flexibility2 Ended Q1’25 with net leverage of ~1.5x; rapidly deleveraging and expect to end 2025 with net leverage of <1.0x2,3 |
| Closing Remarks Vikram Karnani President & Chief Executive Officer |

| Collegium’s Next Phase of Growth 17 Growing Revenue CREATING VALUE FOR SHAREHOLDERS Increasing Profitability Generating Strong Cash Flows Strategically Deploying Capital Disciplined Business Development |
| Q&A |

| Non-GAAP Reconciliations |

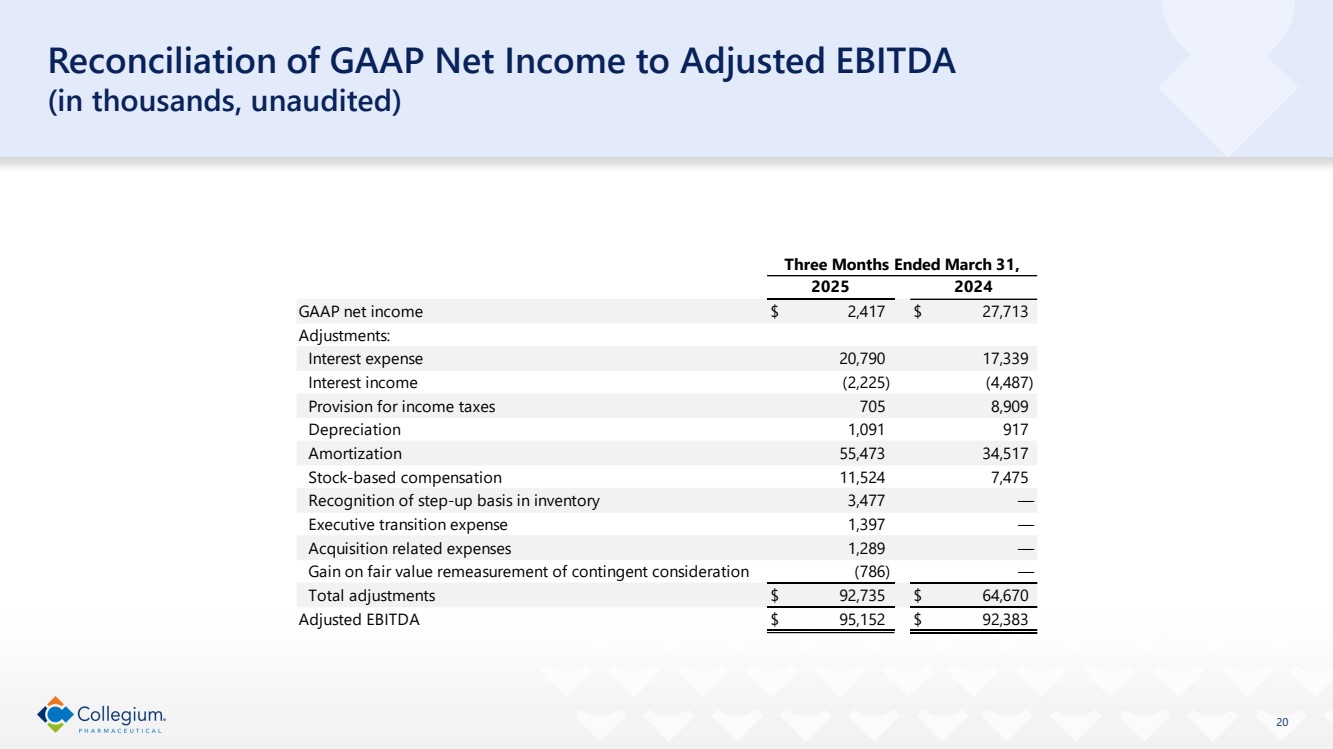
| 20 Reconciliation of GAAP Net Income to Adjusted EBITDA (in thousands, unaudited) GAAP net income $ 2,417 $ 27,713 Adjustments: Interest expense 20,790 17,339 Interest income (2,225) (4,487) Provision for income taxes 705 8,909 Depreciation 1,091 917 Amortization 55,473 34,517 Stock-based compensation 11,524 7,475 Recognition of step-up basis in inventory 3,477 — Executive transition expense 1,397 — Acquisition related expenses 1,289 — Gain on fair value remeasurement of contingent consideration (786) — Total adjustments $ 92,735 $ 64,670 Adjusted EBITDA $ 95,152 $ 92,383 Three Months Ended March 31, 2025 2024 |
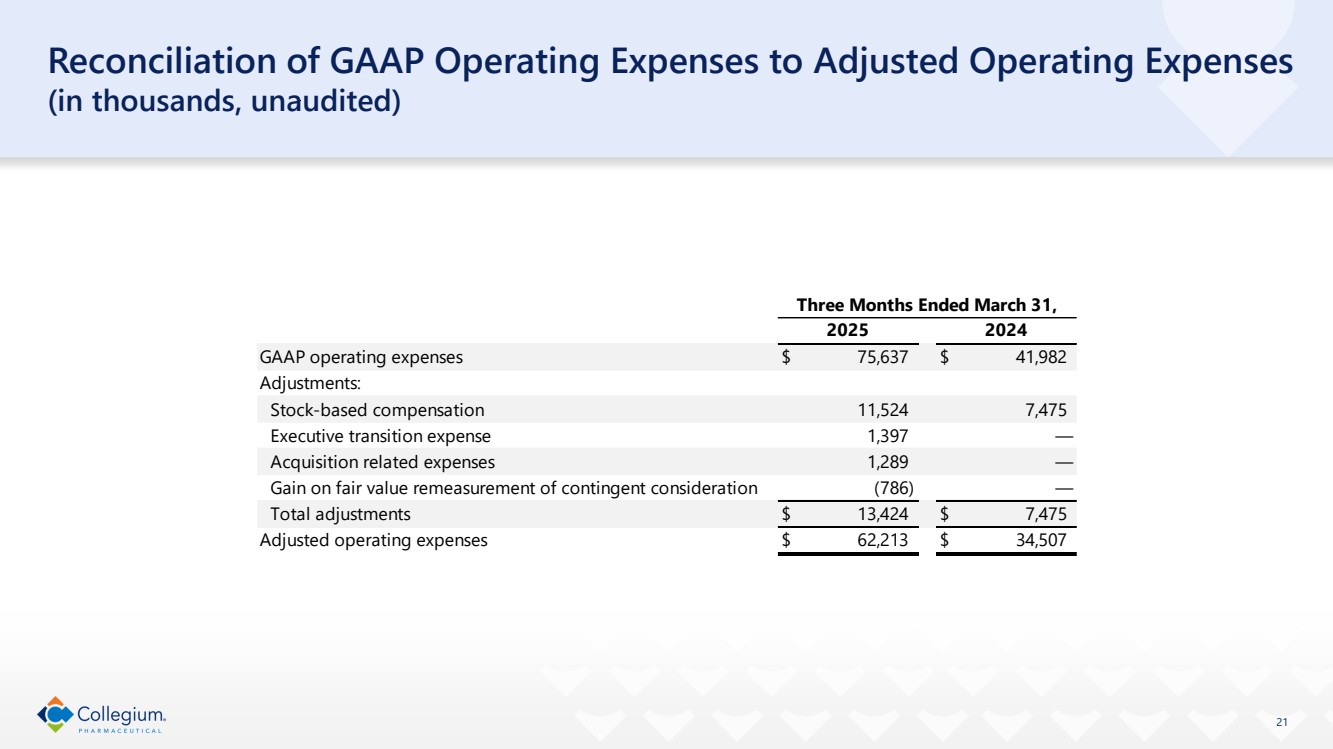
| 21 Reconciliation of GAAP Operating Expenses to Adjusted Operating Expenses (in thousands, unaudited) GAAP operating expenses $ 75,637 $ 41,982 Adjustments: Stock-based compensation 11,524 7,475 Executive transition expense 1,397 — Acquisition related expenses 1,289 — Gain on fair value remeasurement of contingent consideration (786) — Total adjustments $ 13,424 $ 7,475 Adjusted operating expenses $ 62,213 $ 34,507 Three Months Ended March 31, 2025 2024 |
| 22 Reconciliation of GAAP Net Income to Adjusted Net Income and Adjusted Earnings Per Share (in thousands, except share and per share amounts, unaudited) 1. The income tax effect of the adjustments was calculated by applying our blended federal and state statutory rate to the items that have a tax effect. The blended federal and state statutory rate for the three months ended March 31, 2025 and 2024 were 25.8% and 26.6%, respectively. As such, the non-GAAP effective tax rates for the three months ended March 31, 2025 and 2024 were 25.4% and 28.9%, respectively. 2. Adjusted weighted-average shares - diluted were calculated using the “if-converted” method for our convertible notes in accordance with ASC 260, Earnings per Share. As such, adjusted weighted-average shares – diluted includes shares related to the assumed conversion of our convertible notes and the associated cash interest expense added-back to non-GAAP adjusted net income. For the three months ended March 31, 2025 and 2024, adjusted weighted-average shares – diluted includes 6,606,305 and 7,509,104 shares, respectively, attributable to our convertible notes. In addition, adjusted earnings per share includes other potentially dilutive securities to the extent that they are not antidilutive. GAAP net income $ 2,417 $ 27,713 Adjustments: Non-cash interest expense 1,367 1,780 Amortization 55,473 34,517 Stock-based compensation 11,524 7,475 Recognition of step-up basis in inventory 3,477 — Executive transition expense 1,397 — Acquisition related expenses 1,289 — Gain on fair value remeasurement of contingent consideration (786) — Income tax effect of above adjustments (1) (18,737) (12,653) Total adjustments $ 55,004 $ 31,119 Non-GAAP adjusted net income $ 57,421 $ 58,832 Adjusted weighted-average shares — diluted (1) 39,446,458 41,438,466 Adjusted earnings per share (2) $ 1.49 $ 1.45 Three Months Ended March 31, 2025 2024 |